
Chiranjeevi Maddala
June 1, 2026
Every school that has implemented AI has data. Very few schools have the right data. The difference between a dashboard full of activity metrics that nobody acts on and a dashboard full of outcome metrics that drives real decisions is not a technology problem. It is a measurement design problem. And it must be solved before the implementation begins, not after it has been running for six months and your board is asking what you have to show for the investment.
There is a pattern we have observed across AI implementations that follows the same arc with uncomfortable consistency. A school adopts a platform. The vendor provides a dashboard. The dashboard shows impressive numbers — thousands of student interactions, hundreds of lesson plans generated, teacher login rates, platform engagement scores. The principal presents these numbers to the board at the quarterly review. The board nods. And then a trustee who has been listening carefully asks the question that the dashboard cannot answer: "But are the students actually learning better?"
The silence that follows is not about data availability. The platform has been generating data continuously since the implementation began. The silence is about measurement design — specifically, the difference between activity data, which is easy to collect and easy to present, and outcome data, which is harder to define, harder to collect, and the only data that actually answers the question the board is asking.
This blog gives you the measurement framework that converts AI implementation data from an activity record into an outcome story. It is not a technology framework. It is a thinking framework — a set of decisions about what to measure, when to measure it, how to present it, and what to do when the numbers do not show what you hoped they would show.
The board that trusts your AI outcomes dashboard is the board that helped define what it would measure before the implementation began. Build that conversation into the approval process and you build the trust into the measurement from day one.
Before building the right measurement framework, it is worth being precise about what is wrong with the measurement frameworks most schools are currently using. Activity metrics are not wrong. They are incomplete. The problem arises when they are presented as if they answer questions they cannot answer.
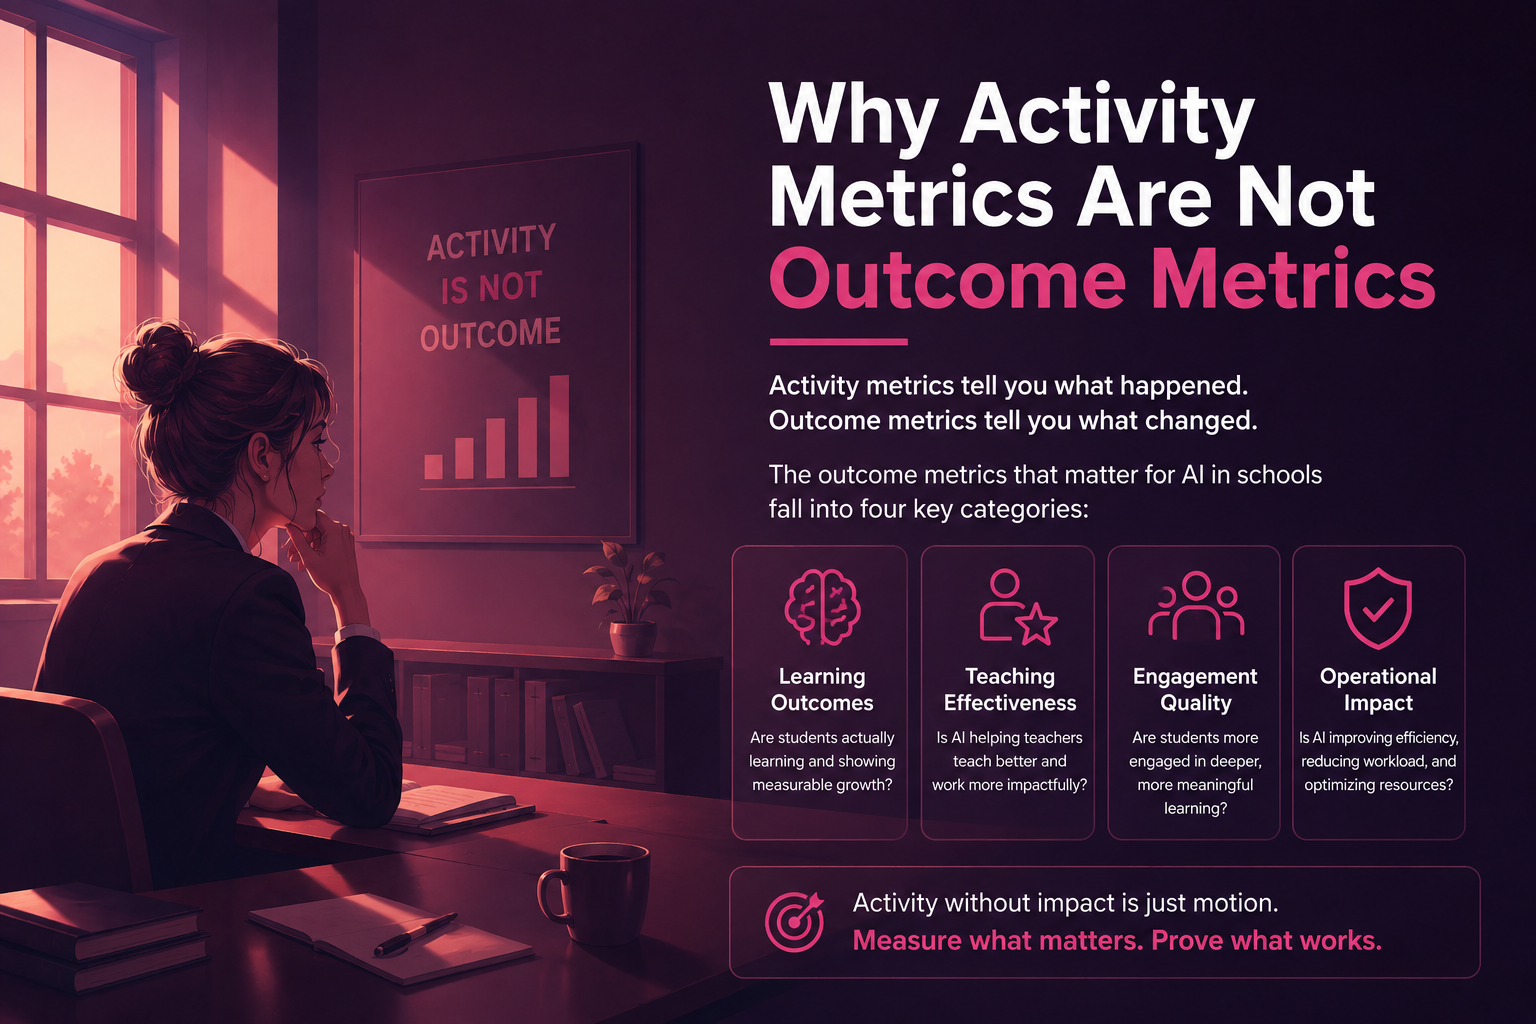
An activity metric tells you what happened. A student logged in 47 times. A teacher generated 23 lesson plans. The platform processed 14,000 student interactions. These facts are real and they are relevant — a platform that nobody uses is not producing outcomes regardless of how sophisticated its technology is. But activity metrics tell you nothing about whether the activity produced the outcomes the investment was intended to produce.
The distinction becomes sharp when you consider two schools with identical activity data. School A and School B both show 15,000 student Cypher interactions over a term. In School A, those interactions are producing genuine understanding development — students are engaging with concepts at increasing depth, their conceptual gaps are being identified and addressed, and their performance on higher-order cognitive tasks is improving. In School B, students have learned to game the platform — they have figured out how to move through interactions quickly without genuine engagement, the platform's data shows completion but not comprehension, and learning outcomes are unchanged.
The activity metric — 15,000 interactions — is identical. The outcome is completely different. A measurement framework that only captures activity cannot tell these two schools apart.
The outcome metrics that matter for AI in schools fall into four categories, each of which requires a different measurement approach and a different data source. Understanding all four is the foundation of a dashboard your board will trust.
Category 1: Learning Outcome Metrics
Learning outcome metrics answer the question the board is most directly responsible for: is this investment producing better education for the students in our care?
The primary learning outcome metric is the comparison between student performance on specific assessment dimensions before and after AI implementation. This requires a baseline — specific assessment data collected before the implementation begins — against which subsequent data can be compared. The baseline does not need to be comprehensive. It needs to be specific enough to be meaningful and consistent enough to be comparable.
For schools using Cypher, the most revealing learning outcome metrics are not the overall score improvements — though those matter — but the cognitive level distribution of performance. The Raipur implementation produced a 34% improvement in final class scores. More significant was the 77% improvement in analysis-level cognitive tasks. This distribution tells you something that aggregate scores cannot: that students are not just knowing more, they are thinking differently. That is the outcome that justifies the educational investment.
Learning gap detection rate is a second learning outcome metric with high board relevance. How many specific learning gaps — not general performance concerns, but specific conceptual misconceptions or missing prerequisite knowledge — has the Morpheus monitoring dashboard identified during the implementation period? How many of those identified gaps have been addressed through targeted teacher intervention? And what happened to the performance of the students whose gaps were identified and addressed?
This metric is powerful for board presentations because it translates abstract claims about personalised learning into a specific, human story. The student who had a Grade 6 algebraic misconception that was silently propagating through seven Grade 8 topics, identified by the monitoring dashboard in Week 6, addressed through a targeted intervention in Weeks 7 and 8, and producing an 18 percentage point improvement in the affected topics by Week 14 — that is not a statistic. It is an outcome.
Category 2: Teacher Effectiveness Metrics
Teacher effectiveness metrics answer the question that board members with financial responsibility are most focused on: is this investment making our most expensive resource — our teachers — more productive?
The primary teacher effectiveness metric is time reallocation: the documented shift in how teacher professional time is distributed between mechanical tasks and high-value pedagogical and relational work. Measuring this requires a before-and-after comparison using the same survey instrument, administered to the same teacher cohort, before the implementation begins and at 90-day intervals thereafter.
The specific question to measure is not "how much time do you save?" — which produces inaccurate answers because teachers do not naturally track their time in this way — but "how did you spend your professional time outside of direct teaching last week?" with a structured list of specific tasks. The shift in the distribution of responses between the pre-implementation baseline and the 90-day follow-up is the teacher effectiveness metric your board needs.
The secondary teacher effectiveness metric is the quality improvement indicator: are teachers who have more time for pedagogical and relational work producing better outcomes with that time? This is measured through the learning outcome metrics above — the teacher whose Morpheus monitoring dashboard surfaced a specific student need that they then addressed is producing better outcomes with the time the platform freed up. The connection between time reallocation and outcome improvement is the metric that makes the teacher effectiveness story complete.
Do not measure teacher effectiveness through platform adoption rates. The principal who presents "84% of teachers are now using Morpheus" as a success metric has presented an activity metric where an outcome metric is needed. The relevant question is not whether teachers are using the platform but whether teachers who are using the platform are producing better outcomes for students. That is a different measurement.
Category 3: Institutional Health Metrics
Institutional health metrics answer the questions that trustees with reputational and financial fiduciary responsibility care most about: is this investment strengthening the school's market position and financial sustainability?
Parent satisfaction with learning visibility is the most directly measurable institutional health metric. Before the implementation, survey parents on one specific question: "Do you have a clear, specific, ongoing picture of how your child is learning and developing in school?" The typical pre-implementation response to this question is 35 to 45% agreement. The post-implementation response, in schools where the Morpheus parent reporting capability is actively used, consistently moves to 65 to 75% agreement within two terms.
This metric matters for the board because parent satisfaction with learning visibility is directly connected to two outcomes that have financial consequences: fee payment continuation rates and referral rates. The parent who says "I have never felt more informed about my child's education" is not a parent who is looking at competitor schools. They are a parent who is telling other parents what they found.
Student retention rate is the second institutional health metric. In competitive school markets, a two percentage point reduction in annual student attrition from 12% to 10% produces significant retained revenue at any school size. Tracking attrition specifically for the cohorts that have been through the full AI implementation — the students whose teachers have the monitoring dashboard data, whose parents have the visibility — against the cohorts that have not yet been through it gives you a specific, attributable metric.
Admissions inquiry quality is the third institutional health metric. Are the families inquiring about enrollment increasingly asking about your AI program specifically? Track this through your admissions inquiry records and your admissions conversation logs. The school that begins to receive inquiries driven by its AI program reputation has a marketing asset that compounds over time and that produces no ongoing cost.
Category 4: Compliance and Governance Metrics
Compliance and governance metrics answer the questions that trustees with legal responsibility need answered: is this investment creating or reducing the school's regulatory and legal exposure?
DPDP Act compliance status is the primary compliance metric. For schools using Matrix on-premises infrastructure, the metric is binary: all student data is processed on school-owned infrastructure with no external transfer. For schools using cloud deployment, the metric requires documentation of the specific data processing agreements in place, the categories of student data processed, the retention periods, and the access controls. The board that can see a specific compliance status rather than a general assurance is the board that is exercising its legal fiduciary responsibility.
Data governance audit readiness is the secondary compliance metric. If a regulatory audit of student data handling occurred tomorrow, could your school produce the specific documentation required to demonstrate DPDP Act compliance? The measurement is not whether an audit is expected but whether the documentation exists. The existence of that documentation is itself the metric.
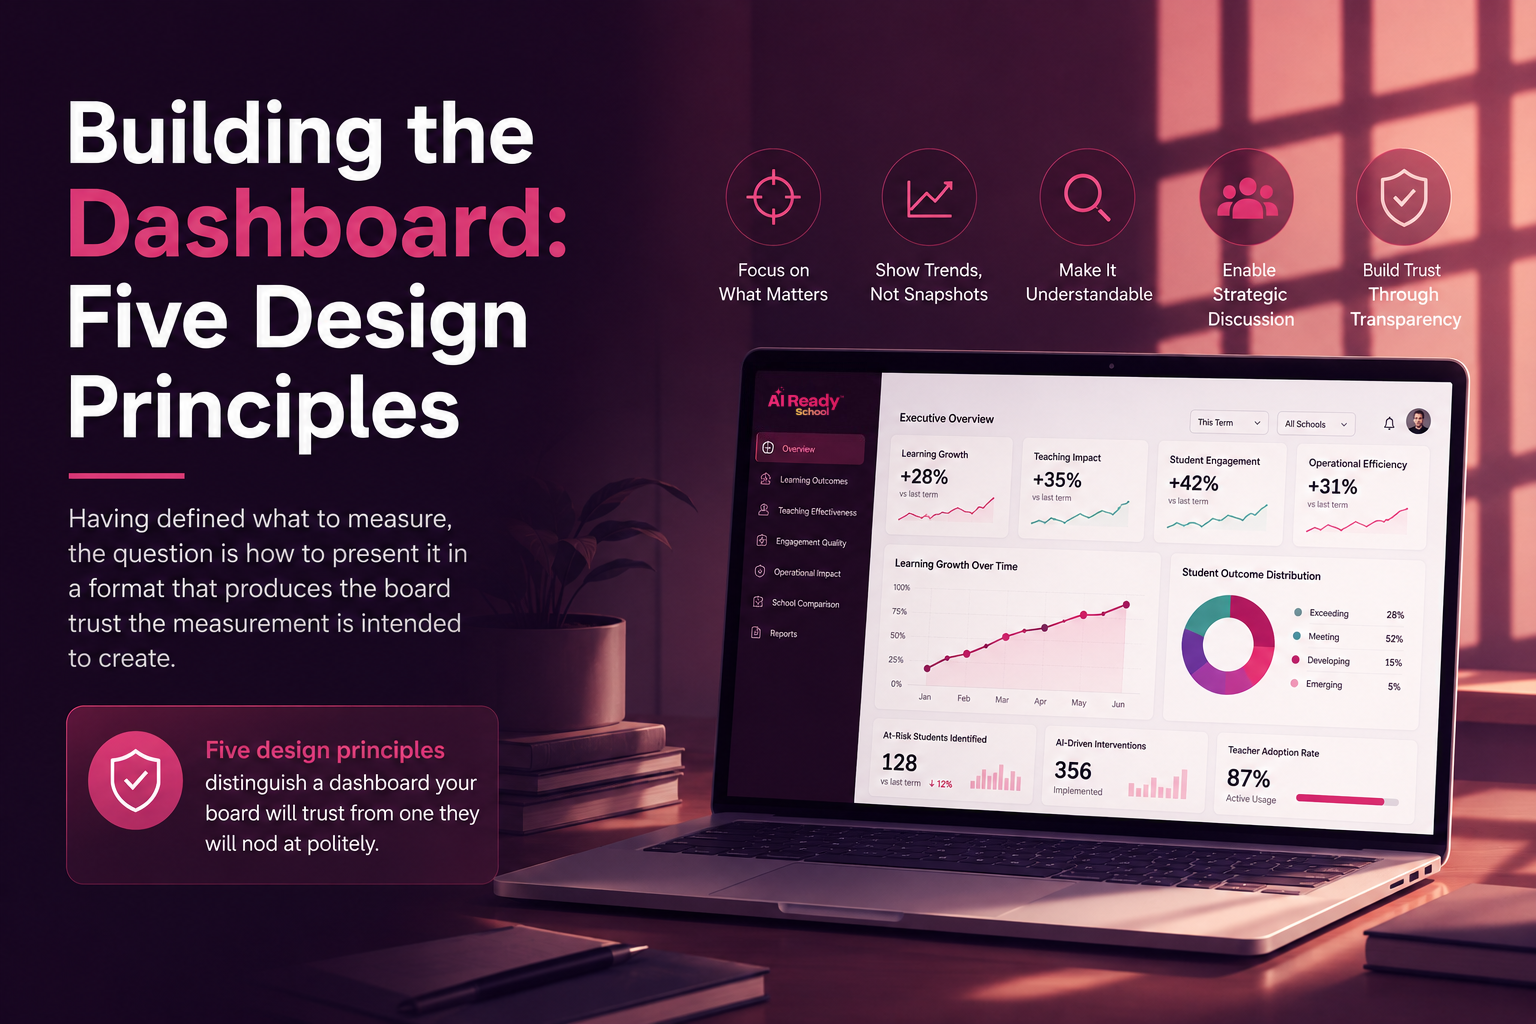
Having defined what to measure, the question is how to present it in a format that produces the board trust the measurement is intended to create. Five design principles distinguish a dashboard your board will trust from one they will nod at politely.
Principle 1: Before and after, always
Every metric on the dashboard should be presented as a comparison between a before measurement and a current measurement. A dashboard that shows "current student assessment performance is 74% average" tells the board nothing. A dashboard that shows "student assessment performance has moved from 68% at baseline to 74% at 90 days, with the largest gain in analysis-level tasks where performance moved from 52% to 71%" tells the board something specific, attributable, and actionable.
The before measurement is only available if it was collected before the implementation began. This is the single most important reason that baseline measurement must happen in the weeks before Day 1 rather than being retrospectively assembled after the implementation is underway.
Principle 2: Student stories alongside statistics
Statistics establish credibility. Stories establish meaning. The board dashboard should contain both, and the stories should be specific and anonymised rather than generic and illustrative.
The monitoring dashboard data from Morpheus generates specific student stories continuously. The student whose declining persistence was detected in Week 6. The student whose Grade 6 misconception was found in Week 4. The student whose learning style mismatch was identified and addressed in Month 2 after three years of being misunderstood by the system. These stories, presented as anonymised case summaries alongside the aggregate statistics, give board members the human context that makes statistics meaningful.
The rule for selecting stories is: use stories that illustrate the mechanism of improvement, not just the fact of improvement. The board does not need to be told that students are doing better. They need to understand how the AI is producing the improvement in a way that justifies continued investment.
Principle 3: Honest about what has not moved
The dashboard your board trusts most is the dashboard that is honest about where the implementation has not yet produced the outcomes you projected. This is counterintuitive but empirically reliable: boards that receive honest reports build more trust in the presenter than boards that receive only positive reports.
Every implementation has areas where the projected improvement has not materialised in the expected timeframe. Teacher adoption in a specific department. Parent engagement with the visibility tools. Student engagement with a specific Zion hub. Including these honestly — with your assessment of why they have not moved and what you are doing about it — demonstrates that you are measuring accurately rather than selectively and that the improvements you do report can be trusted.
Principle 4: Trend lines, not snapshots
A single data point is a fact. Three data points in sequence are a trend. Boards make better decisions from trends than from snapshots because trends tell you the direction of travel, not just the current position.
Where possible, present metrics as three-point trend lines: baseline, 45-day measurement, 90-day measurement. The board that can see "parent satisfaction with learning visibility has moved from 38% at baseline to 52% at 45 days to 67% at 90 days" is seeing a trend that projects forward as well as looking backward. The board that can only see "parent satisfaction is currently 67%" has a single data point that could represent improvement from anywhere or stability at a level they have no context for.
Principle 5: Connected to financial outcomes
The board dashboard should include at least one metric that connects educational outcomes to financial outcomes directly. Not speculatively — specifically.
The most accessible connection is the teacher time reallocation metric translated into an opportunity cost calculation. If 40 teachers are each spending 6 fewer hours per week on mechanical tasks, and their time is valued at ₹300 per hour, the weekly opportunity cost saving is ₹72,000. Over a 40-week academic year, this is ₹28.8 lakh in redeployed professional capacity — capacity that is now going into the relational and pedagogical work that produces better learning outcomes. This is not a cash saving. It is a productivity improvement with a specific financial representation that your finance-oriented trustees understand intuitively.
The dashboard is only as good as the measurement calendar that keeps it current. Here is the specific measurement schedule that produces a dashboard with the data quality your board needs.
Before Day 1 (Week Minus 2): Baseline measurements for all four categories. Teacher time allocation survey administered to pilot cohort. Student assessment data extracted for pilot grade levels and subjects. Parent satisfaction survey administered to pilot teacher cohort parents. Compliance status documentation completed.
Day 45 (Mid-Pilot Check): Teacher time allocation survey re-administered to pilot cohort. First comparison of student performance data from Morpheus monitoring against baseline. Parent satisfaction survey re-administered. Count of learning gaps identified and addressed. First trend line available for all four categories.
Day 90 (Board Review): Full measurement across all four categories. Three-point trend lines available for all metrics with sufficient data. Learning gap case studies selected and anonymised. Admissions inquiry tracking data reviewed. DPDP compliance documentation updated. Board dashboard prepared for formal presentation.
Term 2 Onwards (Quarterly): Quarterly measurement cycle continues with same instruments and expanded to include non-pilot cohorts as implementation expands. Annual comparison available at end of Year 1.
The measurement calendar requires someone to own it. That person is your AI coordinator. Add measurement administration to the AI coordinator's defined responsibilities before Day 1, with specific dates for each measurement event in the academic calendar, and the calendar will be followed. Leave it as a general intention and it will be crowded out by the operational demands of implementation.
Every implementation produces some metrics that move less than projected and some that move more. The response to both determines whether your board continues to trust the measurement framework.
When a metric moves less than projected: investigate the specific cause before the board presentation, present the finding honestly, and describe the adjustment you are making. "Teacher time savings in the Science department are 25% rather than the 50% we projected. This is because the Science HOD's lesson planning approach involves collaborative curriculum design that Morpheus supports differently from solo lesson planning. We have adjusted the workflow for collaborative planning contexts and expect the gap to close in the next measurement period." This is a confident, honest response that demonstrates competence rather than concealing a failure.
When a metric moves more than projected: present it accurately without overclaiming. The board that has been given honest reports about underperforming metrics will trust the reports of overperforming ones. The board that has only been given positive reports will discount positive ones as selective reporting.
When a metric produces a finding that changes the implementation direction: report it to the board as a governance matter rather than managing it internally and hoping it resolves before the next measurement event. The board that is surprised by a material implementation development is the board that loses confidence in the measurement framework. The board that is informed of the development as it emerges — with your assessment of its significance and your proposed response — is the board that deepens its trust in the governance of the implementation.
The board that trusts your dashboard is the board that has seen it report bad news accurately. Show them the bad news with the same precision as the good news and you earn the credibility that makes the good news matter.
AI Ready School works with every partner school to design a custom outcomes measurement framework before implementation begins. The framework includes specific metric definitions for your school's context, baseline measurement instruments for all four categories, the Morpheus dashboard configuration that surfaces the most relevant outcome data for your specific implementation scope, and the board reporting template that presents measurement data in the format trustees can evaluate confidently.
To request a custom outcomes framework session for your school, reach out at hey@aireadyschool.com or call +91 9100013885.
Request a Custom Outcomes Framework Session

.png)